Analytics
The owner's dashboard: twelve numbers, one screen
Profit, months of cash, break-even enrolment and who owes what, built from the fees, salaries and expenses your office already records. Every number links to the report behind it.
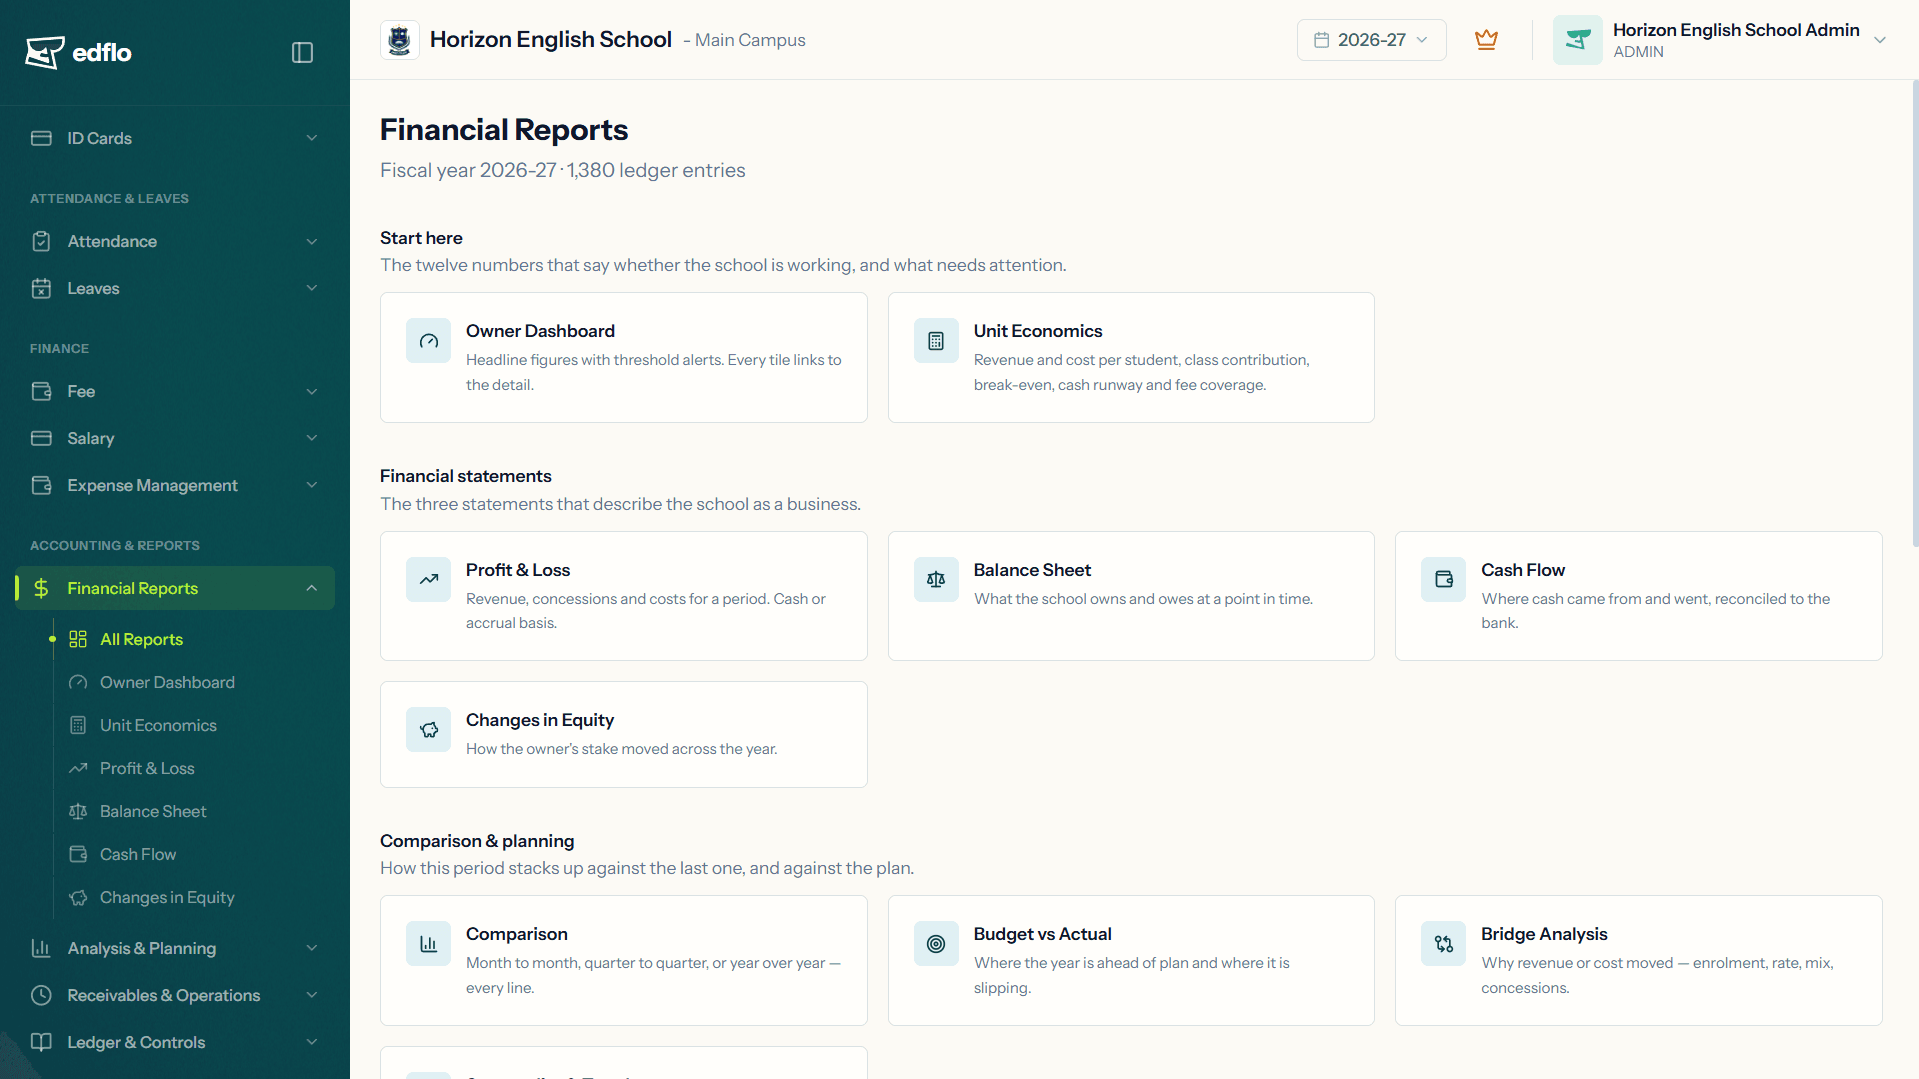
Most school dashboards count things: students on the roll, attendance today, fees collected this week. The owner's dashboard answers a different question: is the school making money, and what needs attention? Because fees, salaries and expenses already post to Edflo's books, every number comes from real transactions rather than a spreadsheet somebody updated last month. Attendance and results trends sit in their own modules, a click away.
Decisions deserve better than spreadsheets
When the numbers live in a fee register, a salary sheet and an accountant's file, the owner's questions get answered once a year. By the time a problem shows up in them, it is months old and harder to fix.
- ×Board reports assembled by hand from several sources
- ×Nobody can say how many months of cash the school has
- ×Problems spotted too late to act on
- ×No quick way to set this month beside last month, or last year
How Edflo helps
The numbers, and a warning when one slips
Twelve numbers on one screen, from net profit and cash runway to collection efficiency and break-even enrolment, each linking to the report behind it. Edflo flags any number that crosses one of its default lines, the same for every school, first as a warning and then as critical.
- Collection efficiency below 80% (warning) or 65% (critical)
- Payroll above 60% or 75% of net revenue
- Cash runway under 6 or 3 months
- More than 15% or 30% of the fees owed over 90 days old
- Operating margin below 5%, or below zero
- Enrolment below break-even (critical)
What one student is worth to the school
Unit economics turns the books into per-student figures: what each student brings in, what each one costs, and what is left. It works out how many students you need to break even at your current fees and costs, how many months of cash you have at your recent rate of spending, and which students on the roll were never billed.
- Revenue, cost and profit per student
- Break-even enrolment and cash runway
- Students on the roll who were never billed
- Estimated contribution by class, with shared costs split per student
Why a number moved
The comparison report sets a month, quarter or year beside the one before, line by line. The bridge analysis splits a change in fee income into the number of students paying and the average fee each one paid. Seasonality shows which months carry the year, with a rolling twelve-month trend.
- Month, quarter and year comparisons on every line
- A bridge from last period's fee income to this one's
- Seasonality, and a rolling twelve months
What the owner gets
Frequently asked questions
What does the owner's dashboard show?
Twelve numbers: net revenue, net profit, operating margin, cash on hand, cash runway, outstanding fees, fees over 90 days, collected this month, collection efficiency, payroll ratio, revenue per student and break-even enrolment. Each one links to the report behind it, so a figure that looks wrong can be checked in a click.
What is break-even enrolment?
Total expenses divided by revenue per student, rounded up, where revenue per student counts the students actually billed. In plain words: how many students you need at your current fees and costs. If your roll falls below it, the dashboard flags it as critical.
How is cash runway worked out?
Cash divided by the average monthly outflow over the last six months. In plain words: months of cash at your recent rate of spending, if collections stopped. Edflo flags it below six months, and again below three.
Why did our fee income fall this month?
The comparison report sets this month beside last month or the same month last year, line by line. The bridge analysis then splits the change into the number of students paying and the average fee each one paid, and shows the overlap between the two separately, so you can see which lever actually moved.
Can we set our own alert levels?
Not at the moment. The lines are Edflo's defaults, the same for every school. They are a prompt to look, not a benchmark for schools in Pakistan, and each alert links to the report that explains it.
Can I see the dashboard on my phone?
Not yet. The owner's dashboard and the financial reports are in the web admin panel. The admin app records expenses and shows fees and salaries.
Are reports ready for board meetings?
Yes. The profit and loss, balance sheet, cash flow and trial balance print as a PDF on your school's letterhead, with prepared-by and approved-by lines, or export as a CSV that opens in Excel.
Get the Edflo app
Admin, teacher and parent apps, on iOS and Android.
See Edflo in action at your school
Start a 15-day free trial, no credit card required. Or book a quick demo and we'll show you around.